Delivering secure income by investing in a portfolio of shared ownership and independent retirement rental homes
Delivering secure income by investing in a portfolio of shared ownership and independent retirement rental homes
Residential Secure Income plc (ReSI plc)
Residential Secure Income plc (LSE: RESI) is a real estate investment trust (REIT) listed on the premium segment of the Main Market of the London Stock Exchange, investing in affordable, safe, high-quality homes.
Residential Secure Income plc aims to deliver stable, inflation-linked returns through investing in affordable shared ownership and retirement rentals across the UK.
ReSI plc targets a secure, long-term, inflation-linked annual dividend and an annual total return in excess of 8.0%.*
The fund aims to make a meaningful contribution to alleviating the UK housing shortage by meeting demand from housing developers (housing associations, local authorities and private developers) for long-term investment partners to accelerate the development of socially and economically beneficial affordable housing.
*These are targets only and not profit forecasts.
At a glance
Key documents
Why invest in ReSI plc?
- A UK REIT focused on delivering secure inflation-linked income
- Investment team has a 20-year track record financing and advising the affordable housing sector
- Focus on two resilient sub-sectors in UK residential, shared ownership and independent retirement living. This is underpinned by an ageing demographic and untapped, strong demand for affordable home ownership
- Targets a secure, inflation-linked dividend (paid quarterly)
- Social impact maximised through a sustainable investment approach, with unique proprietary shared ownership Customer and Environmental Charters
We believe ReSI plc has a unique platform for investment, due to three key factors:
- UK’s largest provider of independent retirement rental management services
- Wholly-owned registered provider of social housing, ReSI Housing Limited
- Innovative ultra long-term funding programme
Investment approach
ReSI plc’s purpose is to generate secure income for shareholders by delivering affordable, high-quality, safe homes with great customer service and long-term stability of tenure for residents. ReSI plc aims to achieve this through meeting demand from housing developers (housing associations, local authorities and private developers) for long-term investment partners to accelerate the development of socially and economically beneficial affordable housing.
The key differentiators of ReSI plc’s investment approach are:
- Secure rents underpinned by pensions, housing welfare or shared owner stakes
- Incredibly diversified income stream from thousands of homes and residents
- Over £30k of government subsidy received for each new shared ownership home we deliver via ReSI Housing Limited, our wholly-owned for-profit Registered provider of social housing, allowing us to provide below-market rents to residents compared to private rented housing*
- Unique proprietary shared ownership Customer and Environmental Charters maximises social impact
*Source: Gresham House
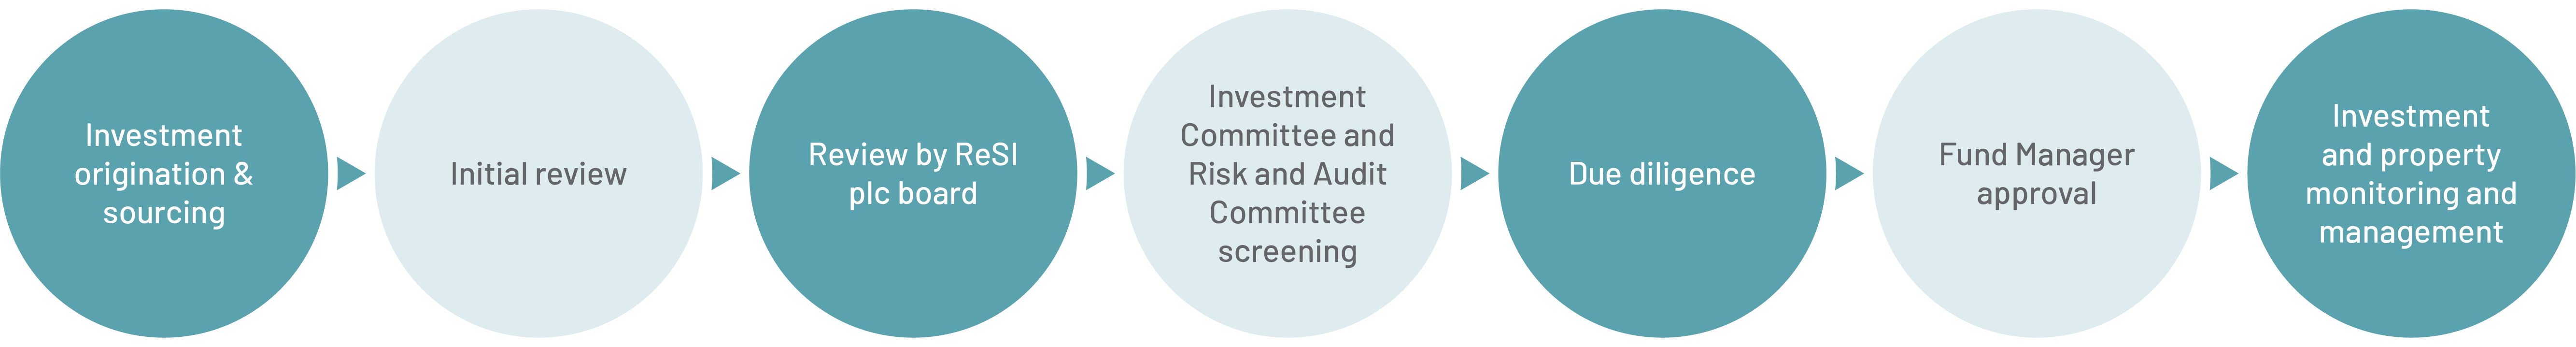
Investment process
Portfolio overview
Shared ownership
766 Homes (including committed acquisitions)
£124mn valuation (including committed acquisitions)
-
- Shared ownership will be the predominant focus of ReSI plc’s investment strategy
- Affordable homeownership through part-buy, part-rent
- Shared owners purchase a c.25% stake in a property and pay a below market rent on the remaining 75% owned by ReSI plc
- Shared owners have the option to staircase (i.e. purchase a larger share in the property at the then market value), releasing bulk discounts to ReSI plc
Social impact
-
- Shared ownership opens the door to homeownership
- Provides lifetime security of tenure through long-term leases
- Creates additional sub-market rental homes

Retirement
2,240 Homes – the largest retirement rental portfolio in the UK
£201mn valuation
- Rental payments are de-linked from the economy as tenants pay through their pensions, housing benefits, etc.
- Provides fit-for-purpose homes for retired people, allowing them to maintain their independence without care provision
Social impact
- Living with peers helps address loneliness, the largest health problem for an elderly population
- Frees up large family homes
- Renting avoids the burdens and transaction costs of ownership and assured tenancy leases provide lifetime security of tenure
Local authority
289 Homes
£20mn valuation
- Leased directly to local authorities who have a statutory duty to house those at risk of homelessness
- Focus on areas with most need for accommodation and strong supply/demand dynamics
- Rent around market levels to minimise downside if local authority does not renew lease
Social impact
- Provides homes to those who are homeless or at risk of homelessness
- ReSI plc acts as an institutional landlord, ensuring standards of accommodation are maintained

How to invest
ReSI plc shares are traded openly on the London Stock Exchange and can be purchased through a stockbroker or other financial intermediary.
The shares are available through savings plans (including Investment Dealing Accounts, ISAs, Junior ISAs and SIPPs) which facilitate both regular monthly investments and lump sum investments in the ReSI plc’s shares. There are a number of investment platforms that offer these facilities. An example can be found below:
Computershare – Share Dealing Service
A quick and easy share dealing service is available to existing shareholders through the ReSI plc’s Registrar, Computershare Investor Services, to either buy or sell shares. An online and telephone dealing facility provides an easy to access and simple to use service.
For further information on this service please visit www.computershare.trade or call 0370 703 0084 (calls are charged at a standard geographic rate and will vary by provider. Calls outside the United Kingdom are charged at the applicable international rate). Lines are open from 8.00am to 4.30pm Monday to Friday (excluding public holidays in England and Wales).
Before you can trade you will need to register for the service. Shareholders should have their Shareholder Reference Number (‘SRN’) available. The SRN appears on share certificates and it will be required as part of the registration process.
Our Registered Provider
ReSI plc’s wholly-owned subsidiary, ReSI Housing Limited (ReSI Housing) is authorised and regulated by the Regulator of Social Housing as a for-profit Registered Provider of social housing. Being a Registered Provider allows for the acquisition of properties designated as affordable accommodation or funded by government grant, expanding the range investment of opportunities available.
Board


ReSI Housing Limited Directors


Investment Committee


Investment team


Distribution team


Distribution team


Distribution team


Investor relations queries
Computershare Investor Services plc
The Pavilions, Bridgwater Road, Bristol BS99 6ZZ
T: 0370 889 3181
W: www.investorcentre.co.uk
Want to keep up to date?
Subscribe using the form below to receive regular updates on Residential Secure Income plc.